Overview
Quantitative Findings
Before conducting paired analyses, the initial dataset of 14 matched pre- and post-training surveys was cleaned to ensure data integrity. One participant was excluded for completing both surveys consecutively (two minutes apart). For a participant with multiple post-survey submissions, only the first complete submission was retained. This resulted in a final matched sample of n=13.
Two complementary scoring methods were applied to the 10-item AI-LITS test: (1) Raw Percentage — total correct answers out of 10; (2) IRT Ability Score (θ) — a 3-Parameter Logistic model using validated fixed item parameters from Hornberger et al. (2025), weighting questions by difficulty, discrimination, and adjusting for guessing probability.
AI Training & Interest in AI Study
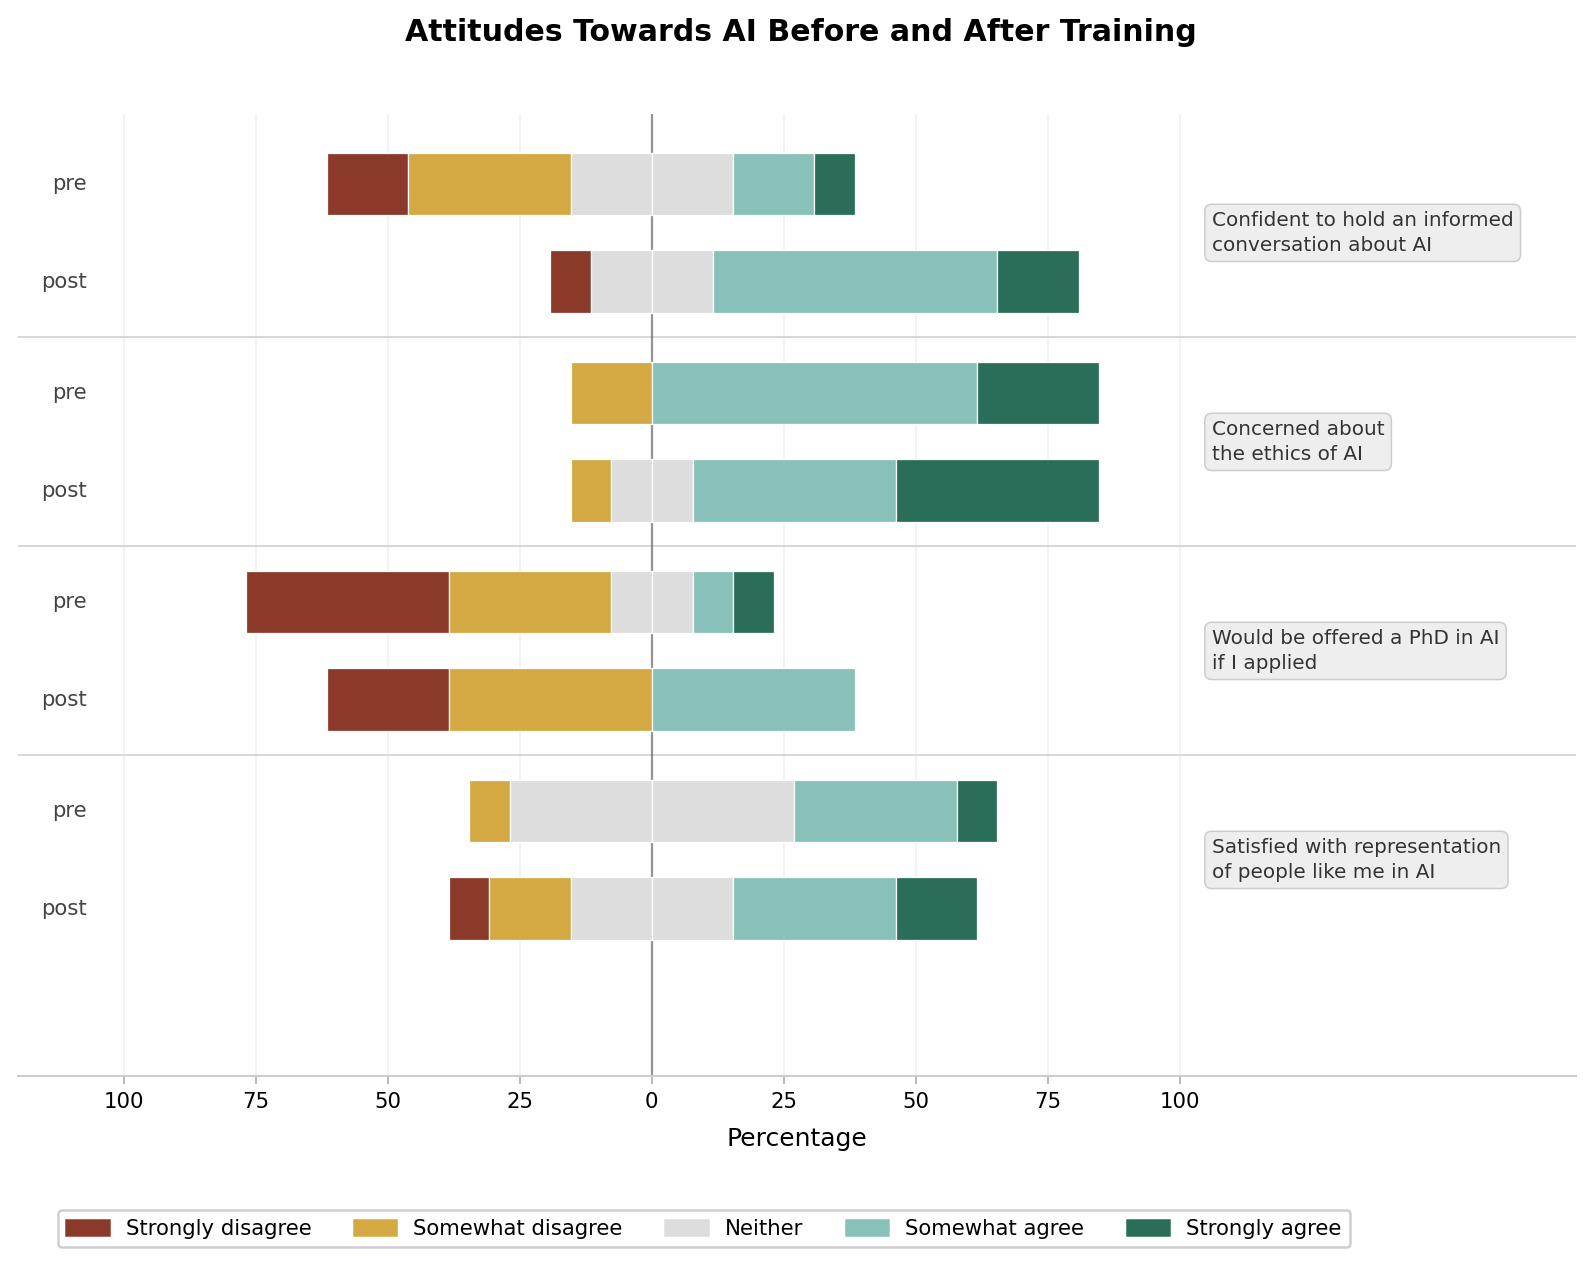
Figure 1: Pre- and post-training shifts in AI attitudes (n=13). Diverging stacked bar chart showing a marked increase in confidence to discuss AI, alongside positive directional trends in perceived PhD eligibility and representation.
Shifting Attitudes: PhD Confidence
When asked to rate their agreement with the statement, "I think I would be offered a place to study a PhD in AI if I applied" (1 = Strongly Disagree to 5 = Strongly Agree), the median score remained static at 2.0 (Disagree) before and after training. The mean score shifted positively from 2.15 to 2.54, which a Wilcoxon test indicated is a weak trend approaching, but not reaching, statistical significance (W = 18.0, p = 0.094).
A similar pattern emerged regarding the direct question, "Would you consider applying for a PhD in AI?" (0 = No, 1 = Maybe, 2 = Yes). The median response remained firmly at 1.0 (Maybe). Whilst the mean score rose slightly from 0.77 to 0.92, this change was not statistically significant (W = 10.0, p = 0.375).
Key Interpretation
Collectively, the quantitative data suggests that whilst the training successfully increased objective AI literacy (as seen in H2), a short technical intervention alone is insufficient to significantly alter deeply held career intentions or overcome confidence barriers regarding PhD admissions.
Key Finding (H1)
Whilst training successfully increased objective AI literacy (H2), the short technical intervention alone is insufficient to significantly alter deeply held career intentions or confidence barriers regarding PhD admissions.

Figure 2: Raw AI literacy questionnaire scores before and after training. This histogram illustrates a significant 16.2% increase in the mean score (from 52.3% to 68.5%) for the 13 participants, indicating clear knowledge acquisition.
Raw Score Improvement
52.3%
Pre-Training
68.5%
Post-Training
+16.2pp
p = 0.024 ✓
A paired-samples t-test confirmed the raw improvement was statistically significant (p = 0.024), confirming the training successfully imparted measurable knowledge of core AI concepts.
Does Training Increase AI Literacy?

Figure 3: IRT ability scores from the AI literacy questionnaire. Based on the 3PL IRT model, this histogram shows the shift in mean ability from 0.09 to 0.59 (n=13), representing growth of nearly half a standard deviation.
IRT Model: True Ability Shift
0.094
θ Pre-Training
0.586
θ Post-Training
The mean true ability estimate increased substantially — nearly half a standard deviation (≈0.5 SD). The 3PL IRT model introduces higher variance than raw scoring, rendering the analysis statistically underpowered at n=13. Nevertheless, strong directional alignment between both measures supports overall intervention efficacy.
Socio-economic Status & AI Study Interest
Sample Composition (n=13)
Hypothesis testing not possible due to insufficient lower SES representation.
Lesson Learned
Future research should employ a purposive sampling strategy to actively recruit students from diverse socio-economic backgrounds. As a key lesson learned, engagement with AI training opportunities may already be unequal at the point of access.
Severe Demographic Skew
The self-selecting nature of the training attendees revealed a severe demographic skew: 12 of the 13 matched participants fell into the Higher SES category, leaving only 1 participant in the Lower SES category. Due to this extreme imbalance, formal comparative hypothesis testing is impossible.
Whilst statistical conclusions cannot be drawn from a sample size of one, the fact that only a single first-generation student completed the AI training pipeline highlights a critical systemic issue regarding accessibility and early-stage engagement in AI education. Future research should employ a purposive sampling strategy to actively recruit students from diverse socio-economic backgrounds, which would yield much stronger and more robust findings on this front.
Table 1 (Table 4): Pre- & Post-Training AI Literacy Score Changes by Subject Area
| Group | n | Mean Pre | Mean Post | Mean Change |
|---|---|---|---|---|
| STEM | 6 | 56.7% | 78.3% | +21.7pp |
| Non-STEM | 7 | 48.6% | 60.0% | +11.4pp |
| All | 13 | 52.3% | 68.5% | +16.2pp |
This table displays the mean raw percentage scores and the average percentage point (pp) change for STEM and Non-STEM cohorts. The STEM cohort started with a higher baseline score and gained more improvement from the training.
STEM vs. Non-STEM AI Literacy

Figure 4: Individual and group shifts in AI literacy by subject area. This slope chart compares the pre- and post-training scores for Non-STEM (n=7, left) and STEM (n=6, right) students. The STEM group began with a higher mean baseline (56.7%) than the Non-STEM group (48.6%). The blue lines indicate improvement, showing that while both groups gained knowledge, the STEM cohort experienced a more pronounced average increase.
The Diverging Trajectories
Prior to training, STEM students exhibited a higher baseline AI literacy than their Non-STEM peers. The STEM cohort achieved a mean raw score of 56.7% (mean θ = 0.251), compared to the Non-STEM cohort's mean raw score of 48.6% (mean θ = -0.041). This confirms that STEM students enter with a slight measurable advantage in AI literacy.
Whilst both groups benefitted from the intervention, STEM students experienced substantially higher growth. The training appears to act as a stronger catalyst for students already embedded in STEM disciplines, effectively widening the literacy gap rather than closing it — suggesting AI training may inadvertently reinforce existing inequalities.
Qualitative Corroboration of H4
"I come from an engineering background, so I've done some Python, and I know like some coding. If I read some code, I would probably understand what it's doing."
STEM Advantage"Maybe it's because of like I don't have that technical background of it. So like I got the base of it, but still like I'm not — probably I won't go for an AI postgrad."
Non-STEM ChallengeFree-Text Survey Responses
The content analysis of the free-text responses in the surveys revealed the frequency of different topics mentioned by participants pre- and post-training, according to three prompts: (A) things that interest them in studying AI, (B) things that interest them in undertaking a PhD, and (C) motivations for or experiences of taking part in the training. Results are presented in order of the highest to lowest percentage of responses to the pre-training survey.
Interest in Studying AI

Figure 5: Bar chart displaying the percentage of responses which feature the various factors that interest participants in studying AI.
Key Themes
The "Importance or Risks of AI" was the most frequently stated motivator before training (64% of responses), though it reduced to 40% post-training. "Specific Applications of AI" rose substantially from 35% to 60% of responses after training.
"Career Prospects" and "Capacity Building" rose significantly after training — to 50% and 30% respectively — suggesting that as a result of the training, participants' interest in AI became more orientated towards skills acquisition and career preparation.
Interest in Studying a PhD

Figure 6: Bar chart displaying topics related to participants' interest in undertaking a PhD by the percentage of responses in which they featured.
Key Themes
Motivational factors for undertaking a PhD were more closely aligned with knowledge acquisition, personal interests and work-style preferences than expressions of interest in studying AI. The "Pursuit of Knowledge" featured consistently in 66% of pre-training and 71% of post-training responses.
Career prospects rose markedly post-training — from 11% to 42% of responses — reflecting a recognition of the PhD as a viable alternative to entering the job market directly after graduation.
Attendance of the Training Sessions
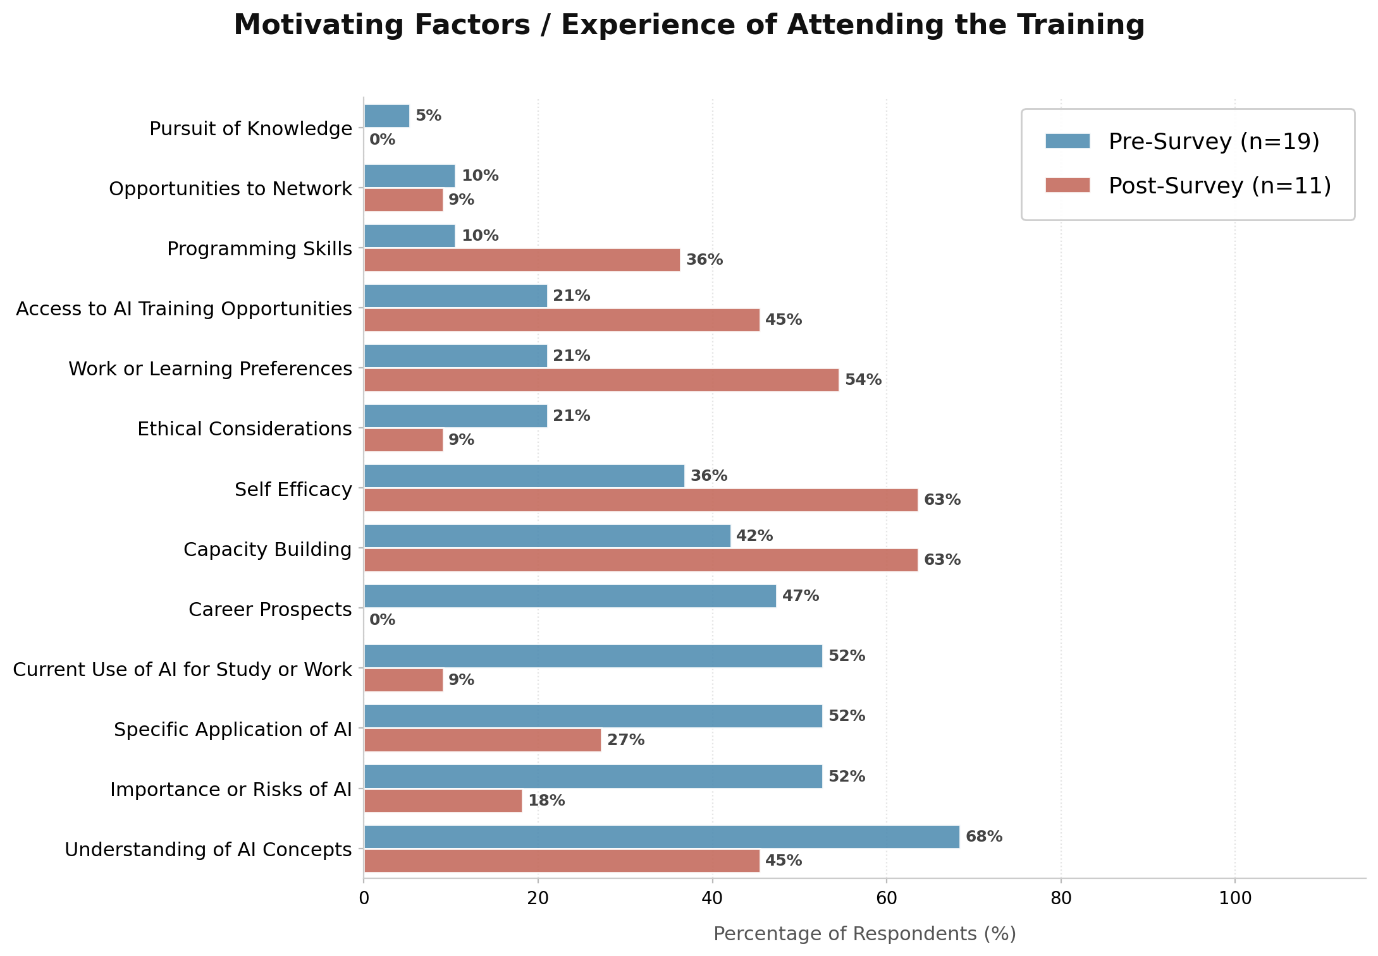
Figure 7: Bar chart displaying the frequency of topics in responses to motivations for (pre-) and experiences of (post-) taking part in the Getting Started in AI training.
Key Themes
Initial motivations were primarily driven by desires to develop technical understanding and use of AI, as well as personal growth. "Understanding of AI Concepts" (68%) was the most common motivator, closely linked to a sense that AI is necessary for "future-proofing" careers.
Post-training, self-efficacy rose from 36% to 63% and "Work or Learning Preferences" from 21% to 54%, reflecting that participants valued the hands-on, practical approach. "Programming Skills" also rose from 10% to 36% of post-training responses, as expected given the technical focus of the syllabus.
Limitations
Content analysis is useful for providing an overview of the topics described by participants. It does not reflect the inconsistent level of detail across responses, which in turn reflects large differences in the degree of consideration participants had given to what interests them in studying AI, undertaking a PhD, and attending the training.
Furthermore, some responses had vague or multiple meanings — for example, the "currency" of AI as a factor for its study. In reviewing the topics, different members of the research team discussed whether this may mean that AI is significant and relevant at the moment, or whether possessing AI skills can be considered as currency in the evolving job market. Encouraging more descriptive free-text responses may have reduced the need for interpretation.
Overall, there was a greater spread of topics mentioned after the training: "Specific Applications of AI", "Financial Considerations", and "Capacity Building" were additional topics that emerged only in post-training responses. The interview participants may have also completed the pre- and post-training surveys, so the two qualitative analyses are not independent of one another.